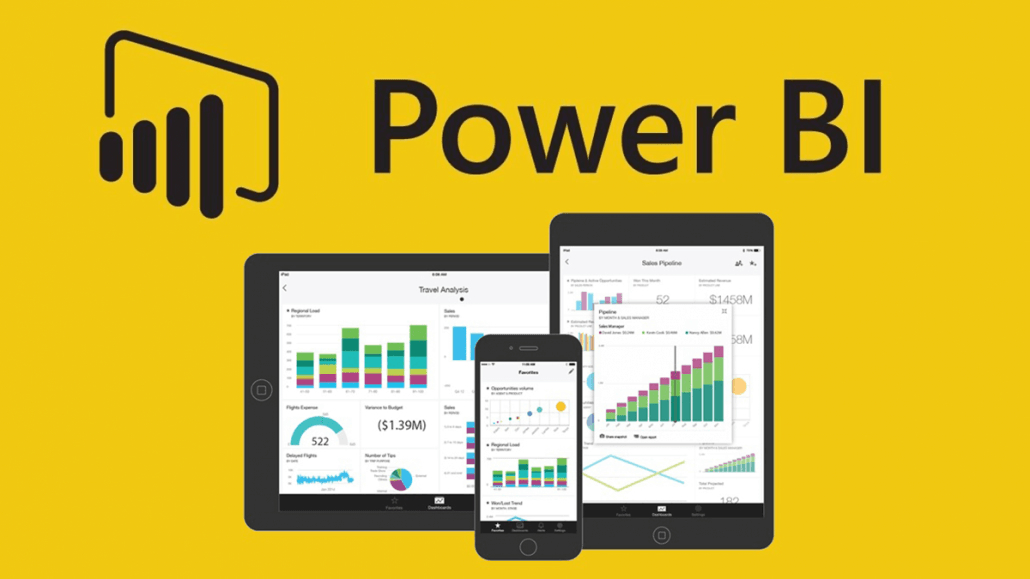
Microsoft Power BI is a business intelligence tool that allows users to connect to various data sources, model and analyse the data, and create interactive visualisations and reports. In this article, we will walk through the process of creating a Power BI dashboard.
Step 1: Connect to your data
The first step in creating a Power BI dashboard is to connect to the data you want to use. Power BI supports a wide variety of data sources, including Excel, CSV, JSON, SQL Server, and more. To connect to your data, click on the “Get Data” button on the Home tab. From there, you can select the type of data source you want to connect to and follow the prompts to connect to your data.
Step 2: Clean and Transform your data
Once your data is connected, you will need to clean and transform it so that it can be used in your dashboard. Power BI has a built-in data modeling and transformation tool called Power Query. You can use Power Query to clean, filter, and transform your data as needed. This step is important to ensure that your data is accurate and consistent and that it can be used to create meaningful visualisations.
Step 3: Create Visualisations
Once your data is cleaned and transformed, you can begin creating visualisations. Power BI has a wide variety of visualisation types to choose from, including charts, tables, and maps. To create a visualisation, click on the “Visualisations” button on the Home tab and select the type of visualisation you want to create. You can then drag and drop fields from your data onto the visualisation and customise it to suit your needs.
Step 4: Arrange and Format your dashboard
Once you have created your visualisations, you can arrange and format your dashboard. You can move visualisations around and resize them to create the desired layout. You can also add filters, slicers, and other interactive elements to your dashboard to make it more interactive and user-friendly.
Step 5: Publish and Share your dashboard
Once your dashboard is complete, you can publish it and share it with others. You can publish your dashboard to the web or share it with specific users. You can also set permissions for different users, so that some users can only view the dashboard while others can edit it.
In conclusion, creating a Microsoft Power BI dashboard is a relatively simple process. With the ability to connect to various data sources, clean and transform data, create interactive visualisations and share it with others, Power BI is a powerful tool for creating insights and making data-driven decisions.
It’s important to keep in mind that the process of creating a Power BI dashboard is an iterative one, and you may need to go back and make changes to your data or visualisations as you work with it. It’s also important to remember to test your dashboard with different sets of data and with different users to ensure that it is accurate and user-friendly.
If you’re interested in finding out more about Power BI or how it could be implimented for you speak to a member of our expert team today!


